반응형
데이터는 iris데이터를 사용하겠습니다. R내장데이터입니다.
설명은 주석으로 달아놓았습니다.
#break 설정
x_ax = seq(0, 10, 0.2)

#히스토그램 만들어서 저장, plot=FALSE로 설정하여 그려지지 않게함
hist1 = hist(iris$Sepal.Length, breaks = x_ax, plot = FALSE)
hist2 = hist(iris$Sepal.Width, breaks = x_ax, plot = FALSE)

#plot 함수를 이용하여 hist1과 hist2를 그림. ann=FALSE로 설정하여 그래프이름과 축이름 나오지 않게함. axes=FALSE로 설정하여 축의 tick이 나오지 않게함.
plot(hist1,
     col = adjustcolor("red", alpha = 0.5),
     ann = FALSE,
     axes = FALSE)
plot(hist2, col = adjustcolor("blue", alpha = 0.5), add = TRUE)

#title함수를 이용하여 그래프이름과 축이름 설정

title(main = "Iris Sepal Length and Width",
      xlab = "height",
      ylab = "Frequency")

#y축 최댓값
ymax = max(max(hist1$counts), max(hist2$counts))

#축 설정
x_axis_tick = x_ax
axis(side = 1, at = x_axis_tick)
y_axis_tick = seq(0, ymax, by = 2)
axis(side = 2, at = y_axis_tick)

#범례 설정
legend("topright", c("Length", "WIdth"), fill = c("blue", "red"))

#테두리 설정
box("figure", col = "gray")
그래프는 아래와 같습니다.

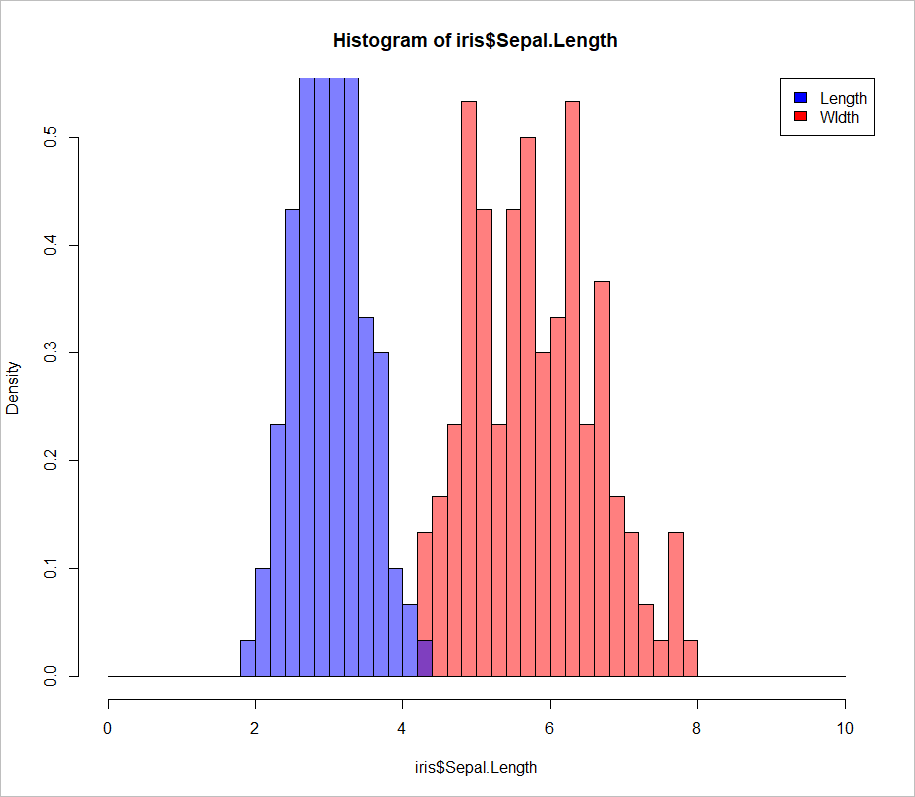
세로축을 Density 로 바꾸고 싶은 경우 freq=FALSE 라는 옵션을 입력해주어야 합니다. 그런데 위와 같이 hist 를 변수에 저장헤고 plot 하는 방식에서는 오류가 발생합니다. 이런경우 아래와 같이 코드를 짜주면 됩니다.
#break 설정
x_ax = seq(0, 10, 0.2)

#히스토그램 만들어서 저장, plot=FALSE로 설정하여 그려지지 않게함
hist(iris$Sepal.Length, breaks = x_ax, freq=FALSE,col = adjustcolor("red", alpha = 0.5))
hist(iris$Sepal.Width, breaks = x_ax,freq=FALSE,col = adjustcolor("blue", alpha = 0.5), add = TRUE)

#범례 설정
legend("topright", c("Length", "WIdth"), fill = c("blue", "red"))

#테두리 설정
box("figure", col = "gray")
반응형
'2. 그래프 그리기 (고수준 함수) > hist() - 히스토그램' 카테고리의 다른 글
| R 누적도수 그래프 (cumsum) (0) | 2020.12.08 |
|---|---|
| R 밀도(density) 히스토그램 (0) | 2020.12.08 |
| R 히스토그램에서 구간은 미만일까 이하일까. (0) | 2020.12.08 |
| [R 그래프] 히스토그램에 빈도값 추가하기 (0) | 2020.08.03 |
| R 히스토그램 그리는 방법, hist() (0) | 2019.12.02 |


댓글